My 2 Cents About Statistics (After Surviving My Statistics Test 😅)

A while ago, I wrote something about measures of central tendency — mean, median, and mode. Yesterday, I finally finished my statistics test, so I thought this would be a good time to write down my current understanding of statistics as a whole.
This is not a textbook explanation, and I am definitely not a statistics expert. This is just my attempt to connect everything I learned and understand the bigger picture. There are probably areas where my understanding is still incomplete, but that's the fun part of learning. Maybe future me will read this and laugh at some explanations, and that's completely okay.
Everything Starts With Data
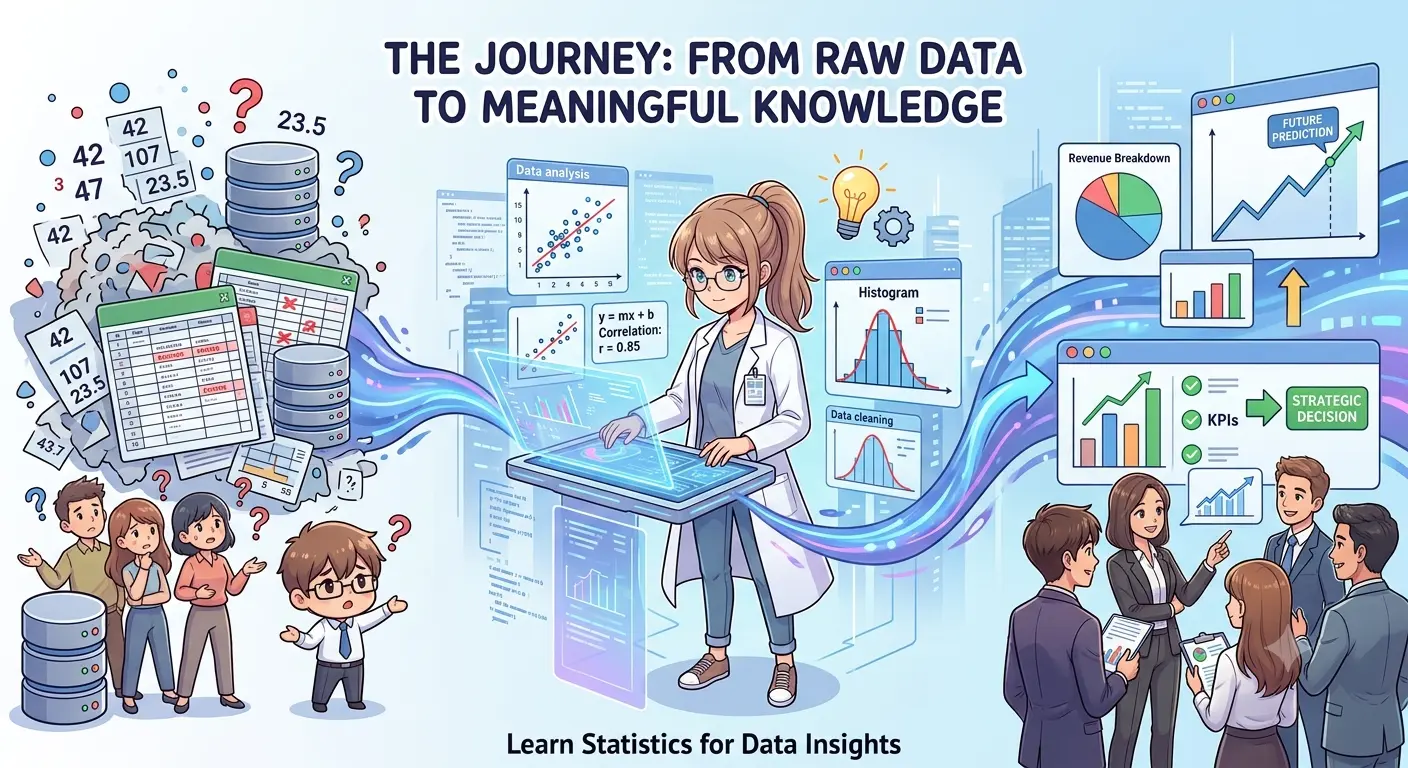
Almost everything in statistics starts with one thing: data.
We always hear that data is valuable, and honestly, it is difficult to disagree. But raw data by itself is not very useful. A huge database with millions of records does not automatically give us meaningful answers. We need ways to understand, organize, and extract knowledge from that data.
That is basically where statistics comes in.
Statistics is the science of dealing with data. It involves collecting data, organizing it, analyzing it, interpreting it, and sometimes even making predictions based on what we observe. It is a very broad field because almost every decision-making process can involve data in some way.
A simple way to think about statistics is that it helps us transform messy observations into meaningful information.
Different Areas of Statistics
Statistics is usually divided into a few major areas.
Descriptive Statistics
Descriptive statistics focuses on describing what we already have. It answers questions like:
"What happened?"
It summarizes data using values such as averages, percentages, ranges, and visualizations. For example, calculating the average score of a cricket player over a season is descriptive statistics because we are only describing past performance.
Inferential Statistics
Inferential statistics is where things become more interesting.
Instead of analyzing an entire population, we usually take a sample and use it to make conclusions about the larger population.
It answers questions like:
"Based on this sample, what can we say about the whole population?"
Most real-world statistical decisions are based on inference because studying an entire population is often impossible.
Prescriptive Statistics
Prescriptive statistics goes one step further.
Instead of asking what happened or what might happen, it asks:
"What should we do?"
This is commonly used in decision-making systems, optimization, recommendation systems, and many modern AI applications.
Data Quality Matters
Since statistics is all about data, the quality of data becomes extremely important.
If the data is incorrect, incomplete, duplicated, or collected in a poor way, even the best statistical methods can produce misleading results.
There is a famous saying:
Garbage in, garbage out.
Statistics can help us understand data, but it cannot magically fix fundamentally bad data.
Understanding the Center of Data
One of the first concepts we usually learn in statistics is measures of central tendency.
The mean, median, and mode help us understand the center of a dataset.
However, the average is not always the complete story.
Imagine a company where most employees earn around Rs. 100,000, but the CEO earns Rs. 20 million. The average salary might suggest that employees are earning much more than they actually are.
This is where the median becomes useful because it represents the middle value and is less affected by extreme values.
The lesson is simple:
The average is useful, but we should always understand the story behind it.
Data Also Has Spread
Knowing the average is not enough.
Two datasets can have the same average but completely different behaviors.
Imagine two cricket players who both have an average score of 50. One player consistently scores between 45 and 55, while another player scores either 5 or 100.
Their averages are identical, but their consistency is completely different.
This is why we need measures of variation such as variance and standard deviation. They help us understand how spread out the data is.
Outliers: The Strange Ones
Sometimes we find values that are completely different from the rest of the data. These are called outliers.
An outlier can be a mistake, such as incorrect data entry, but sometimes it can represent something important.
For example, if a cricket player normally scores around 30 runs but suddenly scores 200, that might be an outlier. But it could also represent a remarkable performance.
The challenge is understanding whether an outlier is noise or a meaningful event.
Why Visualization Matters
Humans are naturally good at finding patterns visually.
This is why statistics uses different types of charts and diagrams.
Histograms help us understand distributions.
Box plots help us identify spread and outliers.
Scatter plots help us understand relationships between variables.
Line charts help us observe changes over time.
Sometimes a simple graph can reveal patterns that are almost impossible to notice from raw numbers.
Today's Outlier Can Become Tomorrow's Normal
One interesting idea in statistics is that what looks unusual today might become normal in the future.
For example, cricket has changed dramatically over time. A strike rate that looked extremely aggressive decades ago might now be considered normal in modern T20 cricket.
The same thing happens in technology, medicine, and sports.
Today's extreme value can become tomorrow's average.
Statistics does not exist separately from the world. The world changes, and the data changes with it.
Sampling: Studying a Small Part of a Big World
One of the biggest challenges in statistics is that studying the entire population is usually impossible.
Imagine trying to measure the average height of every person in Sri Lanka. It would take an enormous amount of time and resources.
Instead, we use a sample.
A sample is a smaller group selected from a population that we use to learn about the larger group.
But the sample needs to represent the population. A bad sample can lead to completely wrong conclusions.
Why Random Selection Matters
Random sampling is important because it gives different members of the population a fair chance of being selected.
Imagine asking only professional basketball players about average human height. The result would obviously be biased.
The same thing happens in surveys and experiments.
A carefully selected sample can provide useful insights, while a biased sample can create false conclusions.
Sampling Bias and Other Traps
Statistics is not only about calculations. A big part of statistics is protecting ourselves from making wrong conclusions.
Selection bias happens when the sample does not properly represent the population.
Self-selection bias happens when people choose whether to participate, causing certain types of people to be overrepresented.
For example, online reviews are often affected by self-selection bias because extremely happy or extremely unhappy customers are more likely to leave reviews.
There are also other dangerous habits.
Cherry picking means only selecting information that supports our argument.
Data snooping means searching through data repeatedly until we find a result that looks interesting.
Vast search problems happen when we test many ideas and eventually find something significant purely by chance.
Statistics teaches us to be careful because humans are very good at accidentally fooling themselves.
Sample Size and Data Quality
People often say that bigger data is always better, but that is not completely true.
A million bad observations are still bad data.
Data quality matters more than just quantity.
However, when data is sparse or highly variable, having a larger sample size helps us produce more reliable estimates.
Central Limit Theorem: One of the Most Beautiful Ideas
The Central Limit Theorem is one of the concepts that made statistics feel more connected for me.
It says that if we repeatedly take random samples and calculate their averages, those averages tend to follow a normal distribution, even if the original data does not.
This idea is the foundation behind many statistical methods.
Standard Error and Bootstrap Sampling
Standard deviation tells us how much individual data points vary.
Standard error tells us how much our sample estimate, such as the sample mean, might vary from sample to sample.
A smaller standard error usually means we have a more precise estimate.
Bootstrap sampling is another interesting concept. Instead of collecting new data, we repeatedly create new samples from the data we already have. This helps us estimate uncertainty and understand how stable our results are.
Confidence Intervals
Statistics usually does not give absolute certainty.
Instead of saying:
"The true value is exactly 50."
We often say:
"We are confident that the true value is likely between 48 and 52."
Confidence intervals help us communicate uncertainty in a more realistic way.
Distributions: Different Shapes of Data
Every dataset has its own behavior.
Some datasets are symmetrical.
Some are heavily concentrated.
Some have extreme values creating long tails.
Understanding distributions helps us choose appropriate statistical methods.
Normal Distribution and Standardization
The normal distribution, or bell curve, is probably the most famous distribution in statistics.
Many natural measurements approximately follow this pattern.
The empirical rule tells us that:
- Around 68% of data falls within one standard deviation.
- Around 95% falls within two standard deviations.
- Around 99.7% falls within three standard deviations.
Standardization helps us compare values from different scales by converting them into Z-scores.
When the sample size is smaller and the population variance is unknown, we often use the t-distribution instead.
Other Important Distributions
Not every dataset follows a normal distribution.
Some important distributions include:
Student's t-distribution — used mainly when working with smaller samples.
Binomial distribution — used for repeated success/failure situations, such as counting how many times a batter hits a boundary.
Chi-square distribution — commonly used with categorical data.
F-distribution — important for comparing variances and ANOVA.
Poisson distribution — useful for counting events within a time period.
Exponential distribution — often used for waiting times between events.
I still have a lot to learn about these distributions, but I like thinking about them as different tools designed for different types of questions.
The Statistical Inference Pipeline
Most statistical investigations follow a similar process.
We start with a question.
Collect data.
Choose an appropriate method.
Perform analysis.
Interpret the results.
Make a decision.
The difficult part is usually not running the test. The difficult part is choosing the correct approach and interpreting the results properly.
Why Hypothesis Testing Matters
Imagine two cricket bat manufacturers claiming their bat improves performance.
How do we know whether the difference is real or just random variation?
This is where hypothesis testing helps.
It gives us a structured way to evaluate evidence.
A/B Testing: Comparing Two Choices
A/B testing is basically a controlled experiment where we compare two different versions to see which one performs better.
Imagine a boxing trainer wants to test whether a new energy drink improves a fighter's performance during training.
The trainer has a group of boxers and randomly divides them into two groups.
One group receives the new energy drink before training. This is called the treatment group because they receive the thing we want to test.
The other group receives the normal drink or a placebo. This is called the control group because it provides a baseline for comparison.
The people involved in the experiment are called subjects.
In this case:
- Subjects → Boxers participating in the experiment
- Treatment → The new energy drink
- Treatment group → Boxers who receive the new energy drink
- Control group → Boxers who receive the normal drink/placebo
Then we measure something.
Maybe punching speed.
Number of successful punches.
Reaction time.
Training performance.
Recovery time.
The goal is to find out whether the energy drink actually creates a meaningful improvement or whether the difference happened randomly.
Hypothesis Testing in A/B Testing
Before running the experiment, we create two competing ideas.
The null hypothesis (H₀) usually represents the idea that there is no real difference.
For example:
"The new energy drink does not improve boxing performance. Any difference between groups is just random chance."
The alternative hypothesis (H₁) represents the idea we are trying to prove:
"The new energy drink improves boxing performance."
After collecting data, we ask:
"Is the difference between these two groups large enough that random chance alone is unlikely to explain it?"
That is the core idea behind hypothesis testing.
Why Do We Need Permutation Tests?
Sometimes we have limited data or we don't want to rely heavily on assumptions about the distribution of the data.
This is where permutation tests become useful.
The main idea is:
What if there was actually no difference between the groups?
If the energy drink has no real effect, then the performance scores of both groups should basically be interchangeable.
A permutation test tests this idea.
Imagine we have the final performance scores:
Treatment group:
90, 85, 88, 92Control group:
80, 83, 79, 82First, we calculate the real difference between the groups.
Then we mix all scores together and randomly shuffle them into two new groups.
We calculate the difference again.
We repeat this thousands of times.
This creates a world where the energy drink has no effect.
Then we ask:
"How often did we get a difference as extreme as our original result just by random chance?"
If it almost never happens, our original result looks unusual, and we have evidence against the null hypothesis.
So permutation testing is basically:
Shuffle → Compare → Repeat → Count extreme results
It lets the data itself tell us how surprising our result is.
Choosing the Right Metrics
Before performing any test, we need to decide what we are actually measuring.
Sometimes the average is useful.
Sometimes the median is better.
Sometimes we are comparing success rates.
The correct metric depends on the type and behavior of the data.
If the data is heavily skewed, using the mean might create a misleading picture.
Hypothesis Testing Concepts
Every hypothesis test starts with two competing ideas.
The null hypothesis (H0) represents the idea that nothing unusual is happening.
The alternative hypothesis (H1) represents the idea that something has changed.
Then we collect evidence and decide whether the evidence is strong enough to reject the null hypothesis.
p-value, Alpha, and Errors
The p-value does not tell us the probability that our hypothesis is true.
Instead, it tells us how surprising our data would be if the null hypothesis was actually true.
Alpha is the threshold we choose before testing, commonly 0.05.
If the p-value is smaller than alpha, we reject the null hypothesis.
But mistakes can still happen.
A Type I error is rejecting a true null hypothesis.
A Type II error is failing to reject a false null hypothesis.
Multiple Testing and Alpha Inflation
One hidden danger in statistics is performing too many tests.
Imagine a boxing scientist testing 100 different energy drinks.
Maybe one improves punching speed.
Another improves endurance.
Another improves reaction time.
Another improves recovery.
Even if none of these drinks actually work, random chance alone may make some results appear significant.
This creates a problem called alpha inflation.
If we normally accept a 5% chance of a false positive (alpha = 0.05), testing many hypotheses increases the overall chance of accidentally finding something "significant."
Basically:
More tests → More chances of false discoveries.
This is why methods like:
- Bonferroni correction
- Tukey's HSD
- False Discovery Rate (FDR)
exist.
They help control the number of false positives when performing multiple comparisons.
ANOVA and Chi-Square
I did not have enough time to fully explore ANOVA, but my current understanding is that it helps compare multiple groups instead of only two.
If ANOVA finds differences, additional tests such as Tukey's HSD can help identify where those differences exist.
Chi-square tests are commonly used with categorical data to understand relationships or compare observed results with expected results.
Multi-Armed Bandits: Learning While Making Decisions
One concept I found really interesting is the multi-armed bandit problem.
Imagine a boxing coach has several different training strategies.
Strategy A improves punching power.
Strategy B improves speed.
Strategy C improves endurance.
But the coach doesn't know which strategy is actually the best.
The coach has two choices:
Exploration
Try different training methods to learn more.
Maybe a new strategy is better, but we haven't tested it enough.
Exploitation
Keep using the strategy that currently gives the best results.
The problem is that focusing only on exploitation might cause us to miss a better option.
But exploring forever wastes time.
This is the exploration vs exploitation problem.
Algorithms like:
Epsilon-greedy occasionally try random options to discover better choices.
Thompson Sampling uses probability and uncertainty to decide when to explore and when to exploit.

I am not a boxing expert, but I really enjoy Hajime no Ippo. Also my favorite boxer is Mike Tyson. Later, I learned that Hajime no Ippo was influenced by real boxing styles, including some elements inspired by Tyson's aggressive peek-a-boo style and powerful hooks.
In boxing, fighters usually do not enter a match without a plan. They study their opponent, understand their strengths and weaknesses, prepare specific techniques, and decide which strategies give them the highest chance of winning.
A good example from Hajime no Ippo is Ippo's fight with Jason Ozuma. Before the fight, Ippo mainly prepared a counter punch for Ozuma's well known finishing blow. The idea was simple: wait for the right moment, use Ozuma's aggression against him, land the counter, and finish the fight.
However, real fights rarely follow a perfect plan.
During the match, the counter punch opportunities were not always available. Ippo had different choices:
- Continue trying to create the perfect opportunity for the counter punch.
- Focus more on defense and avoid unnecessary damage.
- Use his natural blow-to-blow style, where he exchanges punches and relies on his endurance and ability to keep moving forward.
This situation is very similar to the exploration vs exploitation problem.
The counter punch represents exploitation. Ippo already has a strategy that he believes has a high chance of success, so continuing to use it means trusting the knowledge he already has.
The blow-to-blow style represents exploration. It is a different approach where he adapts to the situation, learns from the opponent, and discovers whether another strategy might work better.
A fighter cannot spend the entire match testing every possible technique because time and opportunities are limited. But if they only rely on one strategy, they may miss a better option.
This is exactly the idea behind Multi-Armed Bandits.
Imagine every fighting strategy is like a different slot machine:
- Counter punch → one machine
- Defensive strategy → another machine
- Aggressive pressure fighting → another machine
- Blow-to-blow endurance style → another machine
At the beginning, the fighter does not know which strategy will give the best result in the current situation. They need to balance two things:
Exploration — trying different strategies to discover better opportunities.
Exploitation — continuing to use the strategy that currently seems to work best.
This is the same challenge faced by recommendation systems, online advertising platforms, and AI decision-making systems. They constantly need to decide whether they should continue with what already works or experiment with something new.
In a way, a smart fighter is also making decisions like a learning algorithm. They observe the opponent, update their understanding, and adjust their strategy based on new information.
Fisher's Exact Test
Sometimes sample sizes are very small, and normal approximations are not reliable.
Fisher's Exact Test provides an exact method for analyzing certain categorical problems.
Again, the main idea is choosing the correct tool for the situation.
Final Thoughts
The biggest thing I learned from statistics is not a formula.
It is a way of thinking.
Statistics teaches us to question assumptions.
Is this result real?
Could it just be random?
Was the data collected properly?
Am I accidentally looking only at evidence that supports my belief?